


Table of contents
Custom Metrics are defined in a file deployed on each server that we are monitoring.
To add the custom metrics navigate to the following DIR:
For MySQL: /usr/local/percona/pmm2/collectors/custom-queries/mysql
For PostgreSQL: /usr/local/percona/pmm2/collectors/custom-queries/postgresql
You will notice the following directories under each directory:
high-resolution/ – every 5 seconds
medium-resolution/ – every 10 seconds
low-resolution/ – every 60 seconds
Create a yml file with appropriate name under the resolution you want.
This custom query will get executed and pushed to the PMM database.
if you deploy lots of custom queries you will see a steady number of connections (this is something you will want to consider if you are doing custom collections). Alternatively, you can add queries and metrics to the same file, but they are executed sequentially. If, however, the entire YML file can not be completed in less time than the defined resolution ( i.e. finished within five seconds for high resolution), then the data will not be stored, but the query will continue to run. This can lead to a query pile-up if you are not careful.
Example:
I've a file defining custom query which will push scarping count of last hour and it's located under /usr/local/percona/pmm2/collectors/custom-queries/mysql/low-resolution
scraping_count_last_hr:
    query: "SELECT COUNT(1) as scraping_count, CASE WHEN id % 2 = 0 THEN 'bot-1' ELSE 'bot-2' END as bot_num, scrape_status FROM scraping_db.stock_listings WHERE scrape_status IN ('SCRAPED', 'ERROR') AND updated_at > NOW() - INTERVAL 1 HOUR GROUP BY bot_num, scrape_status;"
    metrics:
      - scraping_count:
          usage: "GAUGE"
          description: "Count of scraping status updated in the last one hour."
      - scrape_status:
          usage: "LABEL"
          description: "The status of the scrape"
      - bot_num:
          usage: "LABEL"
          description: "The label to distinguish between bots."
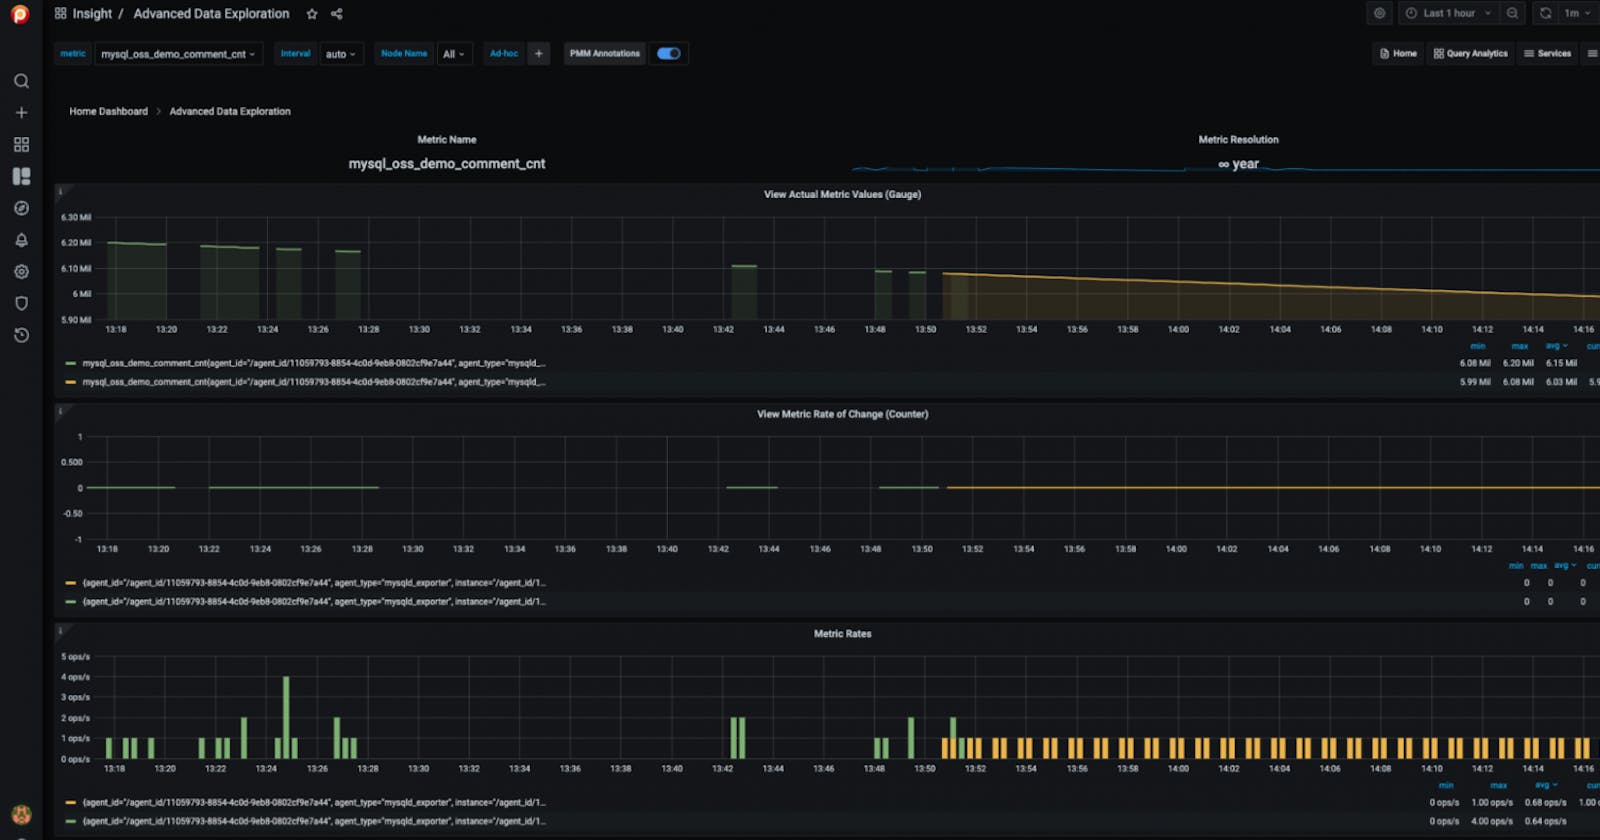
The above file will push the query result after every 60 sec and we can use it in the panel by querying
scraping_db.stock_listingsi.enameSpace_metricName